It wasn’t much until I had the first droplets on my screen (as pixels of course). Thanks to prof. Schrijer, we were able to quickly find out the right camera settings for this setup. It was about a PCO Sensicam with a Nikon ED 180mm and 68mm extension tubes. Because the lenses were rather far from the image sensor, the f stop was set to 4.
The software used to acquire the images was Davis 8.1.5 and the pressure upsetream the injector was recorded by Labview 15.
When looking at the droplets, it is important to freeze the jet as much as possible in order to reduce the blur. One could say that the shutter of the above mentioned camera would be enough, but in fact, is not that fast. In my case a light source was a better option. It can be triggered extremely fast with a perfect synchronization with the camera. The main advantage is that the pulse duration is much shorter than 1μs i.e. the exposure of the camera.
Now looking at the light position with respect to the camera, it is important to understand the goal of this measurements. We want to look at the droplet size and this means that they must be imaged in a high contrast homogeneous way. If the light source is placed behind the camera, the drops will be seen as bright spots only in the middle creating a non-homogeneous area since they are in fact, small spheres. This problem is solved using shadowgraphy, which means that the light source is placed facing the camera. In this way, the camera will see light everywhere except from the regions where droplets/liquid is between the light and the camera.
The difference between lighting from behind/above the camera and shadowgraphy can be seen in the images below.


And the full setup:


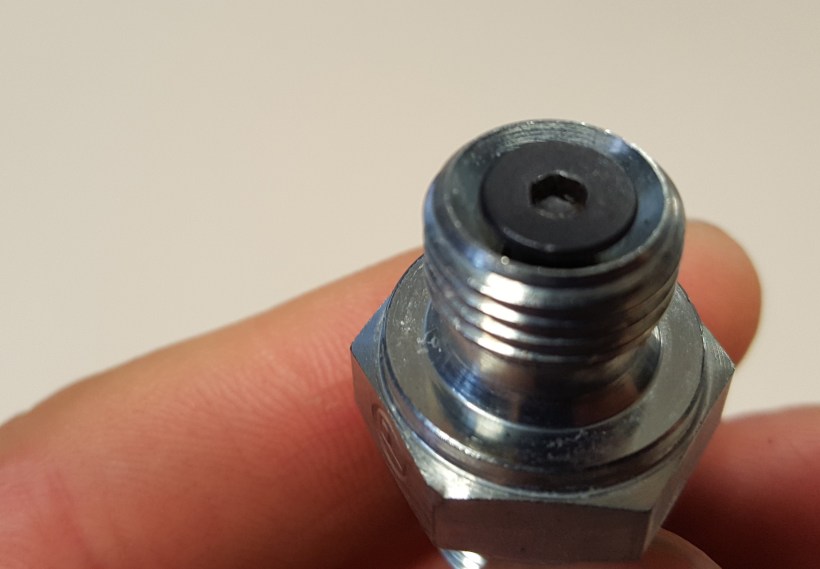
In case you were wondering what happened with the injector, I switched to a pintle as I could not achieve atomization with the plain orifice with only 10 bar. The pintle injector was simply made by centering a flat screw inside a diverging fitting.